Reading from and Writing to FITS Files
What is FITS?
FITS is a ‘flexible image transport system’, that is most commonly used in astronomy because of its utility in transmission, storage and processing of digital images and files. Since, FITS is designed specifically for scientific data, it offers the ability to describe information such as calibration parameters, data origin and metadata.
In this tutorial we will learn to use Astropy IO module named fits to read and write astronomical images and data tables.
Setting Things Up
Assuming that you are able to run python, the first thing you need to do is to install astropy. There are various ways you can do that but the most convenient, which runs across almost all platforms, is to use pip. Open terminal and run the following command.
pip install astropyOnce, in python run the following command to imports fits module:
from astropy.io import fitsTo follow along, you would need a couple of other libraries:
import numpy as np
from matplotlib import pyplot as plt
Writing to a FITS File
A FITS file contains one or more HDUs (Header/Data Units), where the first HDU is generally called the primary header.
The way FITS works is that there is a primary header which contains overall file information, and then subsequent binary tables and images, each defining some aspect of the observation. The binary tables and images also have their corresponding headers (thus forming a data/header unit or HDU). For example, a FITS observation of a distant star may start with information like observer’s name and observation date in the primary header, and then have a table describing the varation of star’s brightness with time.
For the purpose of this tutorial, assume that we want to create a FITS file with a single table that defines time versus energy distribution. So, let’s start with some code and then I will explain.
p_hdr = fits.Header()
t_hdr = fits.Header()

p_hdr['observer'] = 'Usman Khan'
p_hdr['date'] = '14-08-16'

t_hdr['timezero'] = 000848.74
t_hdr['comment'] = 'Fake time versus energy distributions for a tutorial'
First, we initialize a primary header that defines overall file information and a table header that defines certain parameters for the corresponding table. Both are initialized by fits Header() module, which corresponds to a Python dictionary. This means that we can define information using key-value pairs.
Next, we define the data table. Since, this is a time versus energy distribution, we would need two columns in the table defining time and energy respectively.
cols = []
time = np.array([1,2,3,4,5])
energy = np.array([4.2,3.7,5.0,4.8])

cols.append(fits.Column(name='time', format='J', array=time))
cols.append(fits.Column(name='energy', format='E', array=energy))
Here, we populate some fake data and then (much like Header()), we use fits Column() module to intialize time and energy columns. Notice that J and E correspond to int and float data formats, respectively. For a full list, go here.
Once, we are done with all the individual components, we can define an HDU list that will eventually be written to a FITS file.
hdulist = fits.HDUList()

hdulist.append(fits.PrimaryHDU(header=p_hdr))
hdulist.append(fits.BinTableHDU.from_columns(cols, header=t_hdr, name='EVENTS'))

hdulist.writeto('events.fits')
hdulist.close()
By now, you should be seeing a pattern. Each time, we need to do something, we initialize a relevant module and then dump the information. Here we initialize HDUList() module and then append a ‘primary’ and a ‘binary table’ HDU to it.
That’s it. We can then write to a FITS file and close it safely.
Reading from FITS File
We can try reading back the same file that we wrote in the last section. First, we open the file and inspect it.
hdulist = fits.open('events.fits')
hdulist.info()

>>> Filename: events.fits
>>> No.    Name         Type      Cards   Dimensions   Format
>>> 0    PRIMARY     PrimaryHDU       6   ()
>>> 1    EVENTS      BinTableHDU     15   5R x 2C      [J, E]
As expected, we have a primary HDU and BinTableHDU. We can also get a quick glance of the data contained in each HDU. Extracting this data and header information is straightforward.
p_hdr = hdulist[0].header
print(p_hdr['observer'])
>>> 'Usman Khan'

data = hdulist['EVENTS'].data
print(data['time'])
>>> array([1, 2, 3, 4, 5], dtype=int32)

hdulist.close()
ProTip: getdata()
Using getdata(), we can directly extract data from any table. In this case, our desired table is EVENTS whose index number is 1.
fits.getdata('events.fits', 1)
>>> FITS_rec([(1, 4.1999998), (2, 3.7), (3, 5.0), (4, 4.8000002), (5, 0.0)],
      dtype=[('time', '>i4'), ('energy', '>f4')])
Reading and Plotting Image Data
Finally, let’s take a practical example of an astronomical image. First things first, we need to download the data. Fortunately, there is a helper function is astropy that allows to download any web file.
from astropy.utils.data import download_file
image_file = download_file('http://data.astropy.org/tutorials/FITS-images/HorseHead.fits', cache=True )
In this, the image data is contained in the primary HDU. So, we can quickly access using getdata() helper method.
data = fits.getdata(image_file, 0)
plt.imshow(data)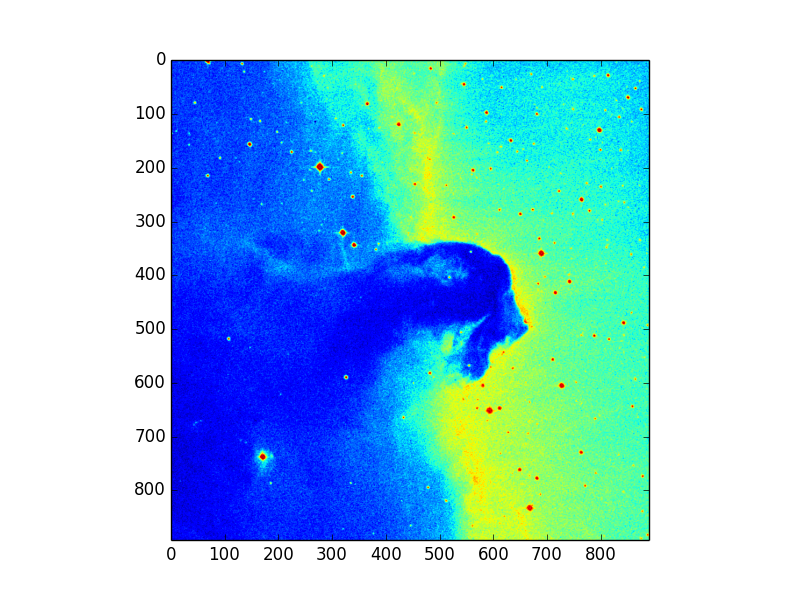
That’s it. Any questions? Ask in the comments, and I will get back to you.
To execute this code without having to write it yourself, head here.